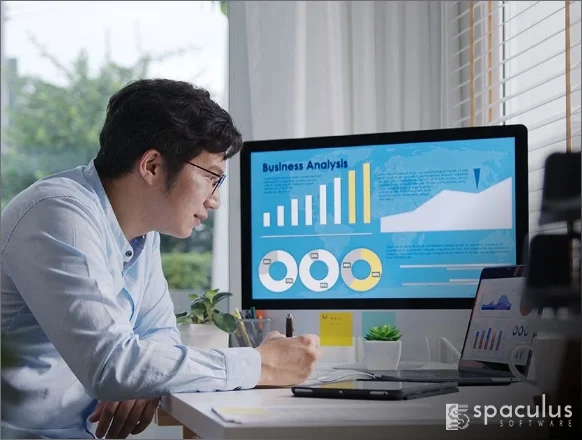
Customized Visualization Strategies empower businesses to translate complex data into intuitive visual representations tailored to their unique needs. By understanding the specific objectives and audience, these strategies delineate the most effective visualization techniques. Leveraging various tools and technologies, these strategies ensure that data is presented in a manner that is easily comprehensible and actionable for stakeholders at different levels of the organization.
The approach begins by comprehensively analyzing the dataset to identify key insights and patterns. It then proceeds to map these findings into visual forms such as graphs, charts, infographics, or interactive dashboards. These strategies prioritize clarity, ensuring that each visualization accurately reflects the underlying data and highlights the essential information. They are adaptive, accommodating evolving business needs and facilitating better decision-making by presenting information in a visually engaging and easily consumable format.
Data Integration and Interpretation involves merging diverse datasets from various sources, harmonizing them, and extracting valuable insights. It begins by collecting data from multiple platforms, databases, or software systems. Once gathered, the data goes through a process of cleaning, transforming, and standardizing to ensure consistency and accuracy. This integration phase aims to create a cohesive dataset that can be effectively analyzed.
Following integration, the interpreted data undergoes analysis and interpretation, aiming to derive meaningful conclusions. Advanced analytical techniques, statistical methods, and machine learning algorithms are employed to unravel patterns, correlations, and trends within the data. This interpretation process is critical in uncovering actionable insights and providing a comprehensive understanding of complex datasets. It allows businesses to make informed decisions based on the interpreted information, enabling strategic planning, identifying opportunities, and addressing potential challenges.
Interactive Dashboard Design is a cornerstone of effective data visualization, providing users with a dynamic interface to explore and comprehend complex datasets. Through intuitive design principles, these dashboards enable users to interact seamlessly with data, gaining insights and making informed decisions. By incorporating interactive elements such as filters, drill-down options, and real-time updates, these dashboards empower users to customize views based on their specific needs, enhancing user experience and facilitating data-driven actions.
- Dynamic Data Filters: Users can filter data based on specific criteria, allowing for focused analysis.
- Drill-Down Capabilities: Enables users to explore deeper layers of data by navigating through hierarchies or categories.
- Real-Time Updates: Provides live data updates to ensure information is current and relevant.
- Visual Storytelling Elements: Uses engaging visuals, charts, and graphs to convey insights effectively.
- Customizable Widgets: Allows users to personalize the dashboard layout according to their preferences.
- Responsive Design: Ensures compatibility across various devices for accessibility and convenience.
Visual storytelling techniques in data visualization involve the strategic use of compelling visuals to convey complex information in a clear and engaging manner. By leveraging these techniques, data becomes more accessible, making it easier for stakeholders to comprehend and derive insights from intricate datasets. Incorporating elements such as infographics, animations, and narrative-driven visuals enhances the storytelling aspect, enabling the data to tell a more compelling and memorable story.
- Infographics: Condenses complex data into visually appealing graphics that are easy to grasp.
- Animations and Interactivity: Engages users by presenting data dynamically and interactively.
- Narrative-driven Visuals: Embeds a story within the data, guiding users through a logical sequence of information.
- Iconography and Symbolism: Uses icons and symbols to represent data points, aiding comprehension.
- Emotive Visuals: Employs colors and imagery to evoke emotions and create a stronger impact.
- Sequential and Flow-based Designs: Structures visuals in a sequence to guide the viewer through a logical flow of information.
Advanced charting and graphing techniques in data visualization elevate the representation of complex datasets, offering a deeper understanding and insight into the information presented. These methods go beyond basic graphs and charts, incorporating sophisticated visual elements that enable users to uncover patterns, correlations, and trends within data more effectively.”
Why Choose Ready to Use Solutions?
- Hierarchical Visualizations: Depicts relationships and structures in multi-level data.
- Heatmaps and Tree Maps: Illustrates data density and hierarchical data structures.
- Network Graphs: Visualizes connections and relationships between data points.
- 3D and Interactive Visuals: Adds depth and interactivity for a more immersive experience.
- Parallel Coordinates: Shows multivariate data points and their relationships.
- Pareto Charts and Box Plots: Highlights significant factors and outliers within data distributions.
User experience optimization in data visualization ensures that insights are presented intuitively, enabling users to derive maximum value from the data presented. It focuses on enhancing the interaction between users and visual data representations, emphasizing clarity, simplicity, and effectiveness.
- Intuitive Navigation: Simplifying the movement across different data points and levels for seamless exploration.
- Responsive Design: Ensuring visualizations adapt well to various devices and screen sizes for accessibility.
- Customizable Views: Allowing users to personalize their visualizations to focus on relevant aspects.
- Interactivity and Tooltips: Providing interactive elements and explanatory tooltips for enhanced engagement.
- Performance Optimization: Ensuring fast loading times and smooth interactions to avoid user frustration.
- Feedback Integration: Encouraging user feedback to refine and improve the visualization experience.


